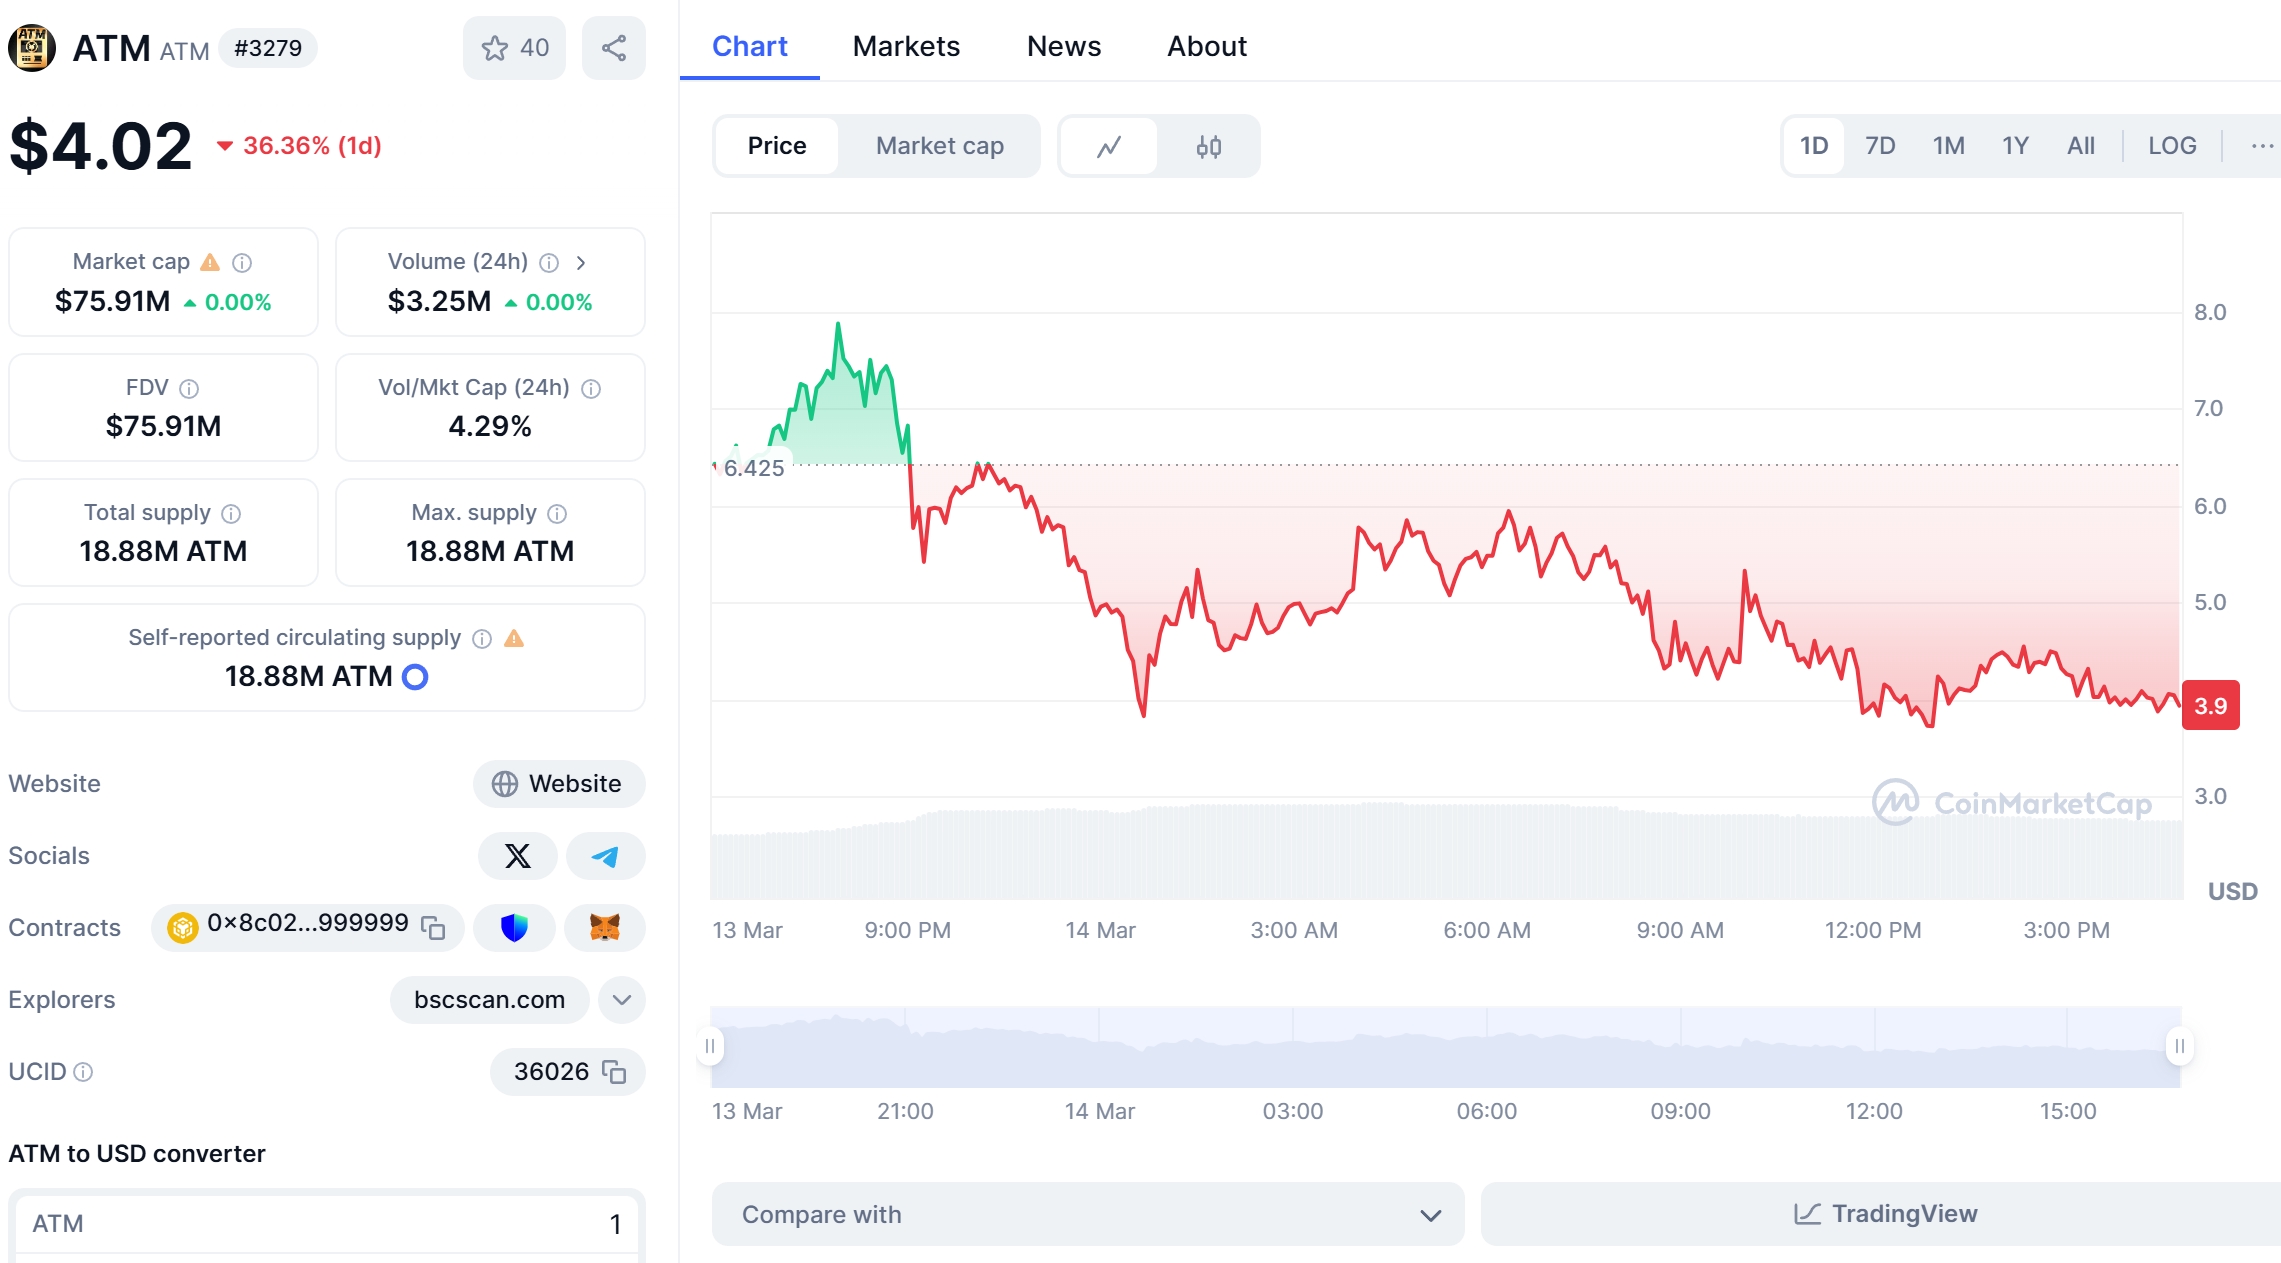
Hey there, crypto enthusiasts! If you’ve been keeping an eye on the market, you’ve probably noticed the rollercoaster ride that ATM coin has been on lately. After hitting an all-time high of $7.87 on March 13, 2025, it’s now trading at a more modest $4.36. But don’t let that discourage you! As a seasoned crypto investor, I’ve seen my fair share of market fluctuations, and today I’m here to break down what’s been happening with ATM coin and what we might expect in the future.
First off, let’s talk about the recent drop. ATM coin fell from its high of $7.87 to $4.36, marking a significant 44.56% decline within just a few hours. This kind of volatility is not uncommon in the crypto world, but it can be unsettling, especially for beginners. So, what caused this drop? Well, several factors could be at play, including market sentiment, regulatory news, or even the broader economic environment. But one thing’s for sure: the crypto market is unpredictable, and ATM coin is no exception.
Now, let’s compare ATM coin’s recent drop to a similar cryptocurrency, like Dogecoin. Back in May 2021, Dogecoin experienced a massive surge, reaching an all-time high of $0.7376. However, it quickly plummeted to around $0.20, a drop of about 73%. The cause? A combination of Elon Musk’s tweets and the realization among investors that the hype might have been overblown. But here’s the interesting part: Dogecoin managed to recover, and it’s now trading at around $0.1683 as of March 2025. The lesson here is that even after a significant drop, a cryptocurrency can bounce back if the community remains strong and the project continues to develop.
So, can ATM coin follow a similar recovery path? It’s hard to say definitively, but there are some positive signs. ATM coin is part of the BNB Chain Ecosystem, which is known for its robust development and growing adoption. Additionally, ATM coin has a total supply of 18.88 million coins, and the circulating supply is the same, indicating a fully diluted market cap of $82.37 million. This suggests that there’s room for growth if the project can capitalize on its potential.
One of the key aspects to consider when analyzing ATM coin’s future is its technical indicators. Let’s delve into some of these to get a better understanding of where the price might be headed. The Relative Strength Index (RSI) for ATM coin is currently around 45, indicating neither overbought nor oversold conditions. This suggests that the market might be stabilizing, which could be a good sign for potential recovery.
Moving averages are another useful tool. The 50-day moving average is currently at $5.12, while the 200-day moving average is at $4.75. If ATM coin can break above the 50-day moving average, it could signal the start of a bullish trend. On the other hand, if it continues to trend below the 200-day moving average, it might indicate further consolidation or a potential downturn.
Bollinger Bands can also provide insights into market volatility. The current bands for ATM coin are relatively wide, suggesting high volatility. However, if the bands start to narrow, it could indicate that the market is calming down, which could be a precursor to a price recovery.
Now, let’s talk about support and resistance levels. The recent drop to $4.36 has established a new support level. If ATM coin can hold above this level, it could be a sign of strength. On the other hand, if it breaks below $4.36, the next support level to watch would be around $3.36, which was the all-time low on March 13, 2025. As for resistance, the next significant level to watch is $5.12, which aligns with the 50-day moving average.
In terms of chart analysis, let’s take a look at the price action over the past few months. The chart shows a clear downtrend after the peak in March 2025, but there are signs of a potential reversal. A double bottom pattern is forming around the $4.36 level, which could indicate that buyers are stepping in and supporting the price. If this pattern holds, it could be a bullish signal for ATM coin.
So, what does all this mean for the future of ATM coin? In the short term, I believe we could see some consolidation around the $4.36 level. If the market stabilizes and the project continues to develop, we might see a gradual recovery towards the $5.12 resistance level. In the longer term, if ATM coin can break above this resistance, we could see a more significant bullish trend.
However, it’s important to remember that the crypto market is highly speculative, and predictions are never guaranteed. That’s why it’s crucial to do your own research and understand the risks involved. As a beginner, it’s a good idea to start with small investments and learn as you go. And if you’re looking for a platform to trade ATM coin, I recommend checking out WEEX. It’s user-friendly, secure, and offers a wide range of cryptocurrencies to choose from.
In conclusion, while ATM coin’s recent drop to $4.36 might be concerning, there are signs that it could recover. By understanding the technical indicators, support and resistance levels, and chart patterns, you can make more informed decisions about your investments. And remember, the crypto journey is all about learning and adapting to the market’s ever-changing landscape. So stay curious, stay informed, and happy investing!
WEEX, a next-generation cryptocurrency exchange, is revolutionizing access to the crypto market. With 1,000+ trading pairs and the WEEX WXT token, users unlock benefits like zero-fee trading. As the WEEX Ambassador, WEEX Owen brings global appeal, making crypto more accessible and exciting for everyone.
