Blum Telegram game frequently features combo codes that challenge users with questions, aiming to engage them with informative content about cryptocurrency investments. On October 10, the phrase “Bitcoin Rainbow Chart” gained significant traction, leading to a surge in online searches and quickly becoming a trending topic. Some users mistakenly interpreted it as a warning or financial advice from Blum Code. In reality, it was the title of an educational video from a popular finance channel, highlighting the risks associated with cryptocurrency investing. In this article, WEEX will guide you through a comprehensive understanding of the Bitcoin Rainbow Chart.
Contents
- 1 Earning Free 250 $BLUM Coins: Bitcoin Rainbow Chart Blum Code
- 2 What Is the Bitcoin Rainbow Chart?
- 3 How Does the Bitcoin Rainbow Chart Work?
- 4 Why Use the Bitcoin Rainbow Chart?
- 5 How Can I Access the Bitcoin Rainbow Chart?
- 6 Limitations of Bitcoin Rainbow Chart
- 7 Discover the Full Potential of Blum Coins on WEEX
- 8 Related Blum Article on WEEX
Earning Free 250 $BLUM Coins: Bitcoin Rainbow Chart Blum Code
The Blum Bitcoin Rainbow Chart code gained widespread attention from cryptocurrency enthusiasts and casual internet users on October 10, 2024, after it was featured as part of the Blum Code Daily Combo in the popular Telegram-based tap-to-earn game. Released a day earlier, on October 9, 2024, the video titled “What Is the Bitcoin Rainbow Chart?” focused on introducing the Bitcoin Rainbow Chart and explaining how to use it for investment purposes.
Blum players can watch the Bitcoin Rainbow Chart video on YouTube to find a special code revealed at the end. By entering this code in the designated area of the Blum app, players can unlock valuable rewards, enhancing their gaming experience and boosting their earnings within the Blum ecosystem. For a comprehensive list of all Blum codes, WEEX has provided a complete summary on WEEX Help.
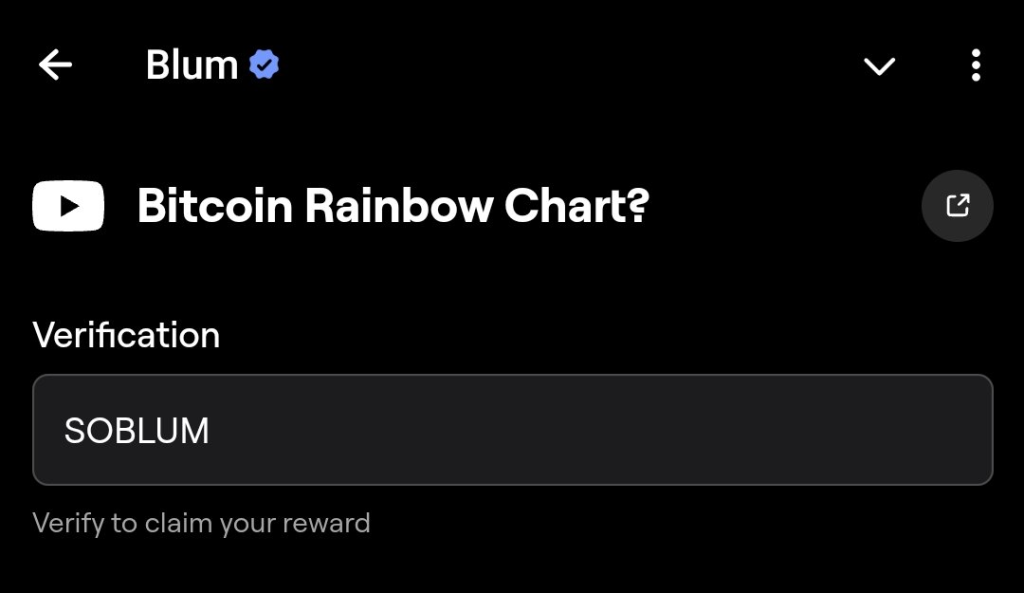
Earn 250 BP BLUM Points by finishing the daily video tasks of 9 October 2024:
Video: Bitcoin Rainbow Chart?
Answer : SOBLUM
What Is the Bitcoin Rainbow Chart?
Unlike other complicated charts, the Bitcoin Rainbow Chart uses a rainbow of colors to represent different market sentiments. While visually appealing, it’s more than just a pretty graphic—it’s built on a solid mathematical foundation known as logarithmic regression. This method helps smooth out Bitcoin’s volatile price swings over time, offering a clearer perspective on its historical performance.
Developed by an anonymous member of the BitcoinTalk forum in 2014, the chart serves as an easy-to-understand representation of Bitcoin’s long-term growth trajectory, without the need for complex technical analysis. Though it’s non-scientific and based purely on historical data, many use it to gain a clearer perspective on where Bitcoin currently sits in its market cycle.

Popular among cryptocurrency enthusiasts and investors, the Bitcoin Rainbow Chart is a visual tool designed to assess Bitcoin’s price movements. The chart’s spectrum of color bands represents various price ranges and market sentiments, with each color indicating a different phase of Bitcoin’s market cycle, from “Fire Sale” (undervalued) to “Bubble Territory” (overvalued).
How Does the Bitcoin Rainbow Chart Work?
The Bitcoin Rainbow Chart features several color bands, each representing varying levels of excitement or caution in the market. For instance, if Bitcoin’s price falls within the blue or dark green bands, known as the “Fire Sale” or “Accumulate” zones, it may indicate that Bitcoin is undervalued. In this scenario, market sentiment is fearful, and savvy investors could view this as a buying opportunity.
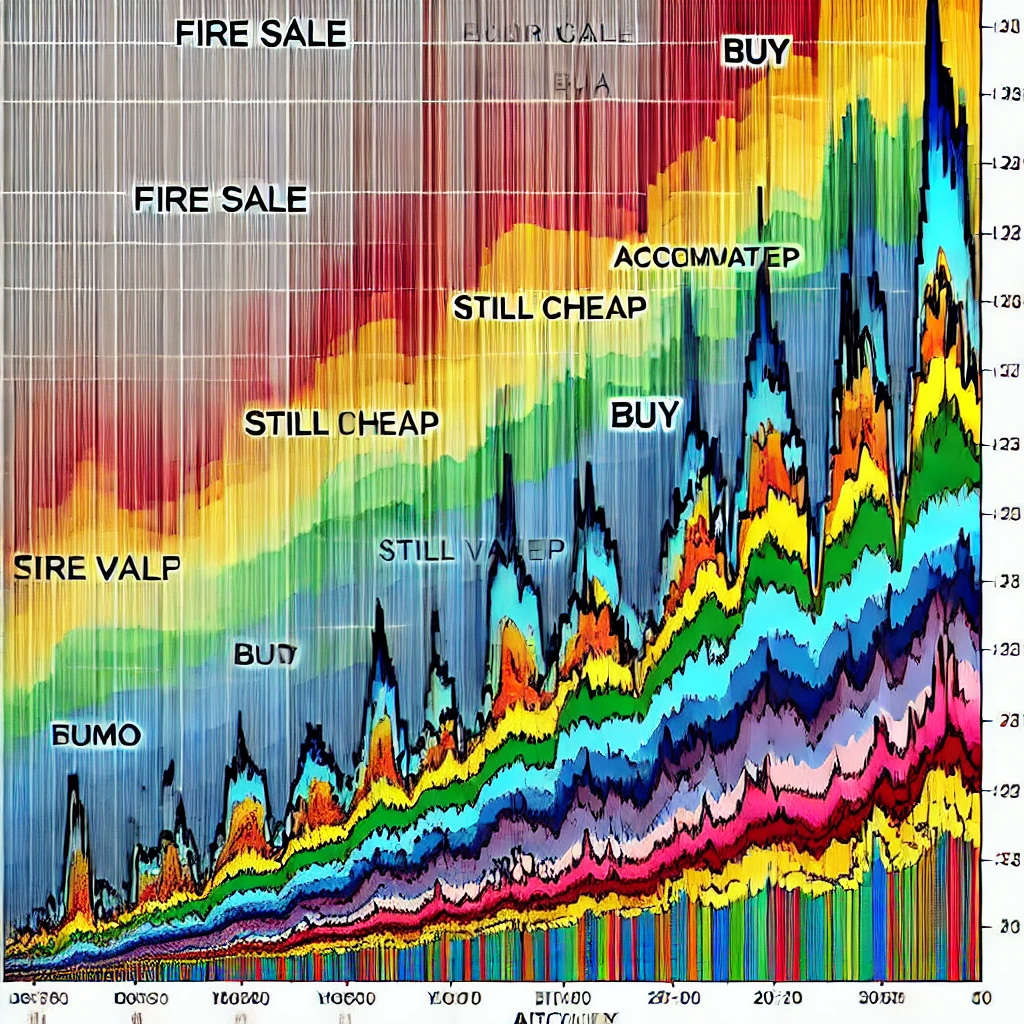
The chart itself is based on a logarithmic scale that spans Bitcoin’s price history, from its early days to the present. The rainbow-colored bands act as a guide for gauging market sentiment, from periods of low enthusiasm to times of excessive speculation. Each color band signals a different stage in Bitcoin’s market cycle, helping investors better understand when Bitcoin might be undervalued or overvalued based on historical patterns.
- Dark Blue & Light Blue: These lower bands are considered “Fire Sale” and “Buy,” signaling that Bitcoin is significantly undervalued.
- Green & Yellow: As prices move up, these colors suggest “Accumulate” and “Still Cheap,” indicating a fair value for long-term investors.
- Orange & Red: The upper bands, labeled “FOMO” and “Bubble Territory,” are warnings that Bitcoin might be overvalued and due for a correction.
The Bitcoin Rainbow Chart is updated frequently and allows users to view Bitcoin’s performance through these market phases. While it doesn’t predict future prices, it gives a broader perspective on where Bitcoin stands in its long-term trend.
Why Use the Bitcoin Rainbow Chart?
- Simple and Visual: One of the main reasons to use the Bitcoin Rainbow Chart is its simplicity. Unlike complex technical analysis tools that require deep understanding, this chart is easy to read and interpret.
- Long-Term Outlook: The Rainbow Chart helps investors focus on Bitcoin’s historical trends over the long term, avoiding the noise of short-term price volatility.
- Strategic Decision Making: While not a precise forecasting tool, the chart offers insights into when Bitcoin might be undervalued or overvalued based on historical patterns. It can guide investment decisions for those looking to buy during dips or sell at peaks.
- Market Sentiment Indicator: The colors on the chart reflect the mood of the market, ranging from cautious optimism (buy signals) to speculative mania (sell signals). This makes it a useful tool for understanding broader market trends.
How Can I Access the Bitcoin Rainbow Chart?
You can find the Bitcoin Rainbow Chart on platforms such as BlockchainCenter.net, as well as custom versions available on TradingView. However, be cautious with alternative versions, as they may not always be reliable. The original and most trusted chart is frequently updated on BlockchainCenter.net, providing a clear and simple way to track Bitcoin’s market trends.

Accessing the Bitcoin Rainbow Chart is both easy and free on numerous cryptocurrency websites and platforms. In addition to BlockchainCenter.net, mobile apps like Blum also incorporate the chart into their ecosystem, offering real-time updates and additional analysis tools. These platforms often combine the Rainbow Chart with features such as Bitcoin price feeds, news, and reward programs, enhancing the user experience.
Limitations of Bitcoin Rainbow Chart
- Non-Scientific Basis: The Bitcoin Rainbow Chart is not based on any specific financial model or scientific method. It simply uses historical data to create a color-coded framework, making it more of a general guide rather than a precise tool.
- No Predictive Power: While it can indicate past trends, the chart doesn’t predict future price movements. Market conditions can change rapidly due to external factors like regulatory decisions, technological advancements, or macroeconomic events, none of which the chart accounts for.
- Over-Reliance on Historical Patterns: The chart is heavily reliant on past performance, which isn’t always a reliable indicator of future outcomes. Bitcoin is a relatively young asset, and its price movements are still influenced by many unpredictable factors.
- Emotional Influence: Some investors may rely too much on the visual appeal of the chart and make emotional decisions based on its color bands. It’s essential to use the chart as one of many tools in your investment strategy rather than a definitive guide.
Discover the Full Potential of Blum Coins on WEEX
WEEX is a premier cryptocurrency exchange, providing a smooth trading experience with sophisticated tools, competitive fees, and strong security protocols. The platform emphasizes user safety through multi-layered security features, including a 1000 BTC investor protection fund, and adheres to financial regulations in various jurisdictions. With support for a wide array of cryptocurrencies, including DOGE/USDT, XRP/USDT and SOL/USDT, WEEX caters to both beginners and experienced traders looking for an intuitive environment. The platform offers advanced trading tools such as WEEX Futures Pro, WEEX We-Launch, and WEEX Copy Trading Pro.
Related Blum Article on WEEX
Liquidity Pools Guide Blum Code|Blum Code 27 September,2024
What Are AMMs Blum Code? Current Summary of Blum Daily Codes
What Is Blum Doxxing Code? All Blum Video Codes October 1
Blum Play Type and Track Code: Complete Summary of Blum Daily Codes
Find us on:
Twitter | Telegram | Facebook|LinkedIn|Blog
Sign up for a WEEX account now: https://www.weex.com/register
[Supported Platforms]:
CoinMarketCap| Feixiaohao| Cryptowisser.com| Coingecko|Coincarp
